A futures headline rate can look much lower than a spot rate. Read the two tables side by side and you find that the percentages are multiplied by different things, unlocked at different thresholds, discounted under different rules, and priced differently again depending on which currency backs the position.
One — what the percentage multiplies
This is the difference that swallows all the others, and it is almost never stated on a fee page because from the platform's point of view it is obvious.
On spot, the rate applies to the value of the trade. For a hypothetical 10,000 USD trade at an assumed 0.10% taker rate, the fee is 10 USD. The number you multiply by is the executed value.
On futures, the rate applies to notional position value, which is your margin multiplied by leverage. Put up 1,000 USD at 10× and your notional is 10,000 USD. At an illustrative 0.05% taker rate that is 5 USD — on 1,000 USD of your own capital. These are teaching assumptions; use the live order ticket for the rate.
Change the leverage and the answer changes with it, which is the point: there is no fixed relationship between the two percentages, because leverage sits between them and leverage is your choice. A fee table cannot tell you what a futures trade costs you, because half the calculation happens after you decide how much to borrow.
The correct comparison is not percentage against percentage. It is: how much fee did I pay, divided by how much of my own money was committed. Run that once at your own leverage and the ranking often reverses.
Two — the tier thresholds use a separate ladder
Both products have tier ladders, and both ladders are labelled with the same words. The volume required to climb them is not the same at all.
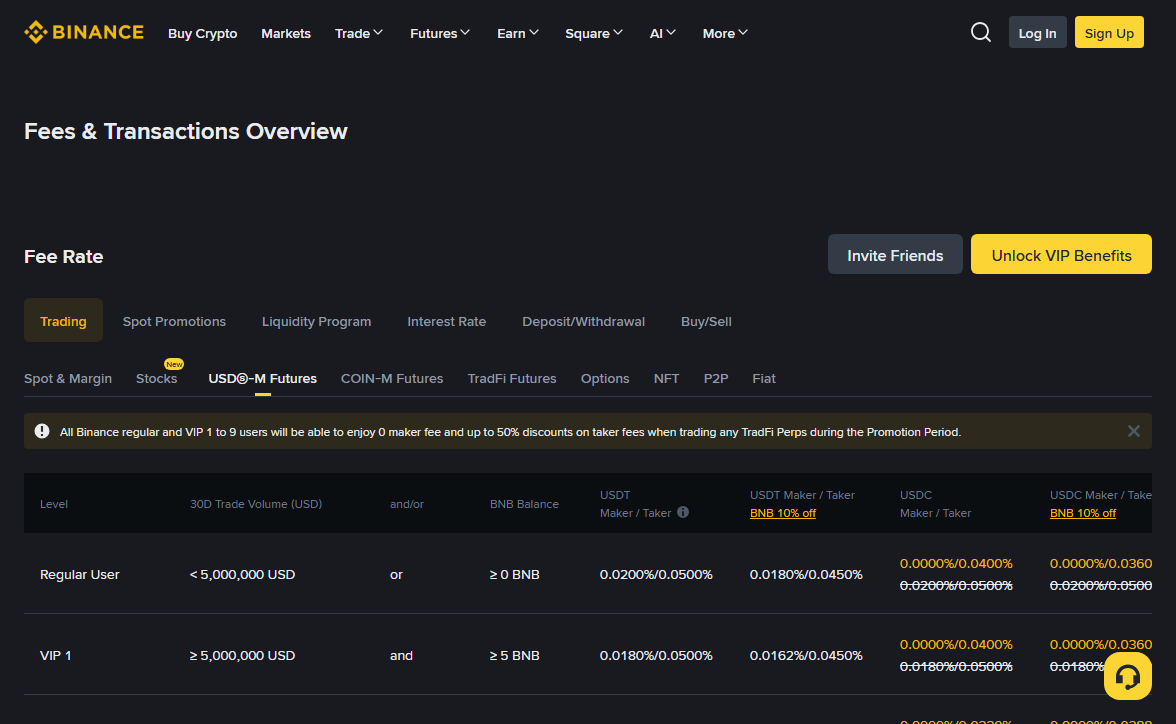
The spot and USD-M futures tables can assign different volume and token-balance conditions to a tier carrying the same name. The regular row and higher rows also use different logical conditions. Read the current row in each product rather than moving a VIP label across.
The practical consequence catches people out. The same account in the same month can sit in different tiers on spot and futures because the ladders are evaluated separately.
Whether volume on one side counts toward the other is a platform-by-platform decision, and it is written on the fee page rather than being an industry convention. It is worth reading before assuming, and it is a specific instance of a more general problem: the rule that decides your tier varies more between platforms than the headline rate does.
Three — the token discount is a different size on each product
On the same published fee page, spot and USD-M futures have separate discounted columns for paying fees in the platform token. The values shown in August 2026 were not the same, and the live page remains authoritative.
So the same token holding, with the same deduction switch enabled, can produce a different saving by product. That difference is invisible unless you read both tables, because each one displays its own discounted column as though it were the only one.
This matters for a decision people make without much thought. If you are holding the platform token principally to reduce trading costs, the value of that holding depends on which product your volume actually goes through — not on the headline discount you remember reading about. For a futures-dominated account, the token is doing considerably less work than the marketing implies.
The mechanics of how the deduction is applied, and what the burn programme does and does not mean for holders, are worked through separately.
Four — the margin currency changes the price
Within futures alone, the same position can carry two different rates depending on which stablecoin backs it.
At the time of the August 2026 capture, USDT-margined and USDC-margined columns showed different rates, and one set was visibly promotional with standard figures struck through beside it. A banner also advertised temporary pricing on selected products. Those observations establish that margin currency and promotion status matter; the image is not a current quote.
Promotional pricing is not a problem in itself. The problem is treating it as a stable input. Two cautions are worth carrying:
- The struck-through figure is what you return to. The promotion has an end, and the page tells you what the price becomes when it ends.
- Switching margin currency to chase a rate has its own cost. You have to acquire the other stablecoin, which means a conversion, which has a spread. On a short holding period that conversion can exceed the fee saving entirely.
The cost that only exists on futures
Perpetual futures carry a recurring payment that has no spot equivalent, and it does not appear on any fee schedule because it is not a fee.
Funding is paid directly between long and short holders at fixed intervals, to keep the contract price tethered to the spot price. The platform does not receive it. But it leaves your account when you are on the paying side, and over a multi-day position it is routinely larger than every trading fee you paid to open and close.
Its sign and size move with market conditions rather than with anything you control. In a market where longs dominate, longs generally pay shorts; when positioning flips, so does the flow. There is no tier that reduces it and no discount that applies to it.
For anything held longer than a single session, this is the dominant cost and the fee table is a rounding error. Any comparison between spot and futures that ignores it is comparing the wrong things.
Liquidation fees belong in the same category: they vary by platform, they are not on the standard fee schedule, and they only ever apply to the futures side.
The same account, both products, worked through
Abstract structure is easy to nod at and hard to act on, so here is the arithmetic with numbers attached. Both the account and the rates below are hypothetical teaching assumptions, not current platform quotes.
Suppose you have 2,000 USD of capital and you want exposure to 10,000 USD of an asset. You are a Regular User on both ladders. Take the round trip — in and out — and take market orders both times, so both sides pay the taker rate.
On spot, you cannot create 10,000 USD of unborrowed exposure from 2,000 USD. At an assumed 0.10% taker rate, 2,000 USD of spot exposure costs 2 USD in and 2 USD out, or 4 USD round trip.
On futures at 5×, the notional is 10,000 USD. At an assumed 0.05% taker rate that is 5 USD in and 5 USD out, or 10 USD round trip. The smaller-looking rate produces the larger fee because it multiplies a larger base.
Now hold the position for three days. Funding is paid at intervals and can add more than the opening and closing fees when the account is on the paying side. Its actual sign and rate must come from the contract at the time of the trade.
Two things fall out of this that no fee table can show you. First, the cost ratio between the products is set by your leverage, not by the published rates — run the same example at 2× and futures looks cheap, at 20× it looks expensive. Second, holding period changes the answer more than either, because one product accrues a recurring cost and the other does not.
Two futures costs that appear on no fee page
Beyond funding, there are two more that belong in any honest comparison and are documented somewhere other than the fee schedule.
The liquidation charge. When a position is closed out because margin has fallen below the maintenance requirement, most platforms apply a fee to that closure, and it is usually well above the ordinary taker rate. Where it is documented at all, it tends to live in the risk or margin documentation rather than the fee page. It is not a cost you plan to pay, which is exactly why it is worth knowing the size of before you are in a position to pay it.
The maintenance margin ladder. The margin required to keep a position open is not a single percentage; it rises in steps as the position gets larger. A position sized comfortably at one notional can be sitting at a materially higher maintenance requirement at a larger one, which means the price at which it liquidates moves closer than a naive calculation suggests. This is published, in a tiered table, and it is not on the fee page because it is not a fee — but it changes the economics of the trade more than any rate on this page.
Neither of these has a spot equivalent, and neither is discounted by any tier or token holding.
How to compare them properly
Stop comparing percentages. Compare amounts of money.
- Confirm the charging base. The fee page states, usually in one line, whether the percentage multiplies trade value or notional value. This one line decides everything downstream.
- Compute your own notional. Margin multiplied by your actual leverage — not the maximum the platform allows, the one you use.
- Count the round trip. Open and close, plus the funding you expect to pay over the holding period you have in mind.
- Divide by the capital you committed. Now the two numbers measure the same thing and can be compared.
Do this once and something usually becomes obvious: your leverage choice affects cost far more than the tier you sit in. That factor appears on no fee table anywhere, because no fee table knows your leverage.
The last thing worth saying is that neither figure includes the largest cost on either product. On both spot and futures, the gap between the maker rate and the taker rate is smaller than the gap between a filled limit order and a market order in a thin book. That cost is real, it is paid on every trade, and it is not reported anywhere. It is a property of how your order interacts with the book, not of your tier.
Run three futures scenarios, not one forecast
A useful cost estimate does not pretend to know the future funding rate. It carries three scenarios: funding received, funding near zero and funding paid. For each one, write down the notional, expected holding time, settlement interval and the rate visible for that contract when you check. The platform's funding history can show a range, but it cannot guarantee the next interval.
Then add two market outcomes. In the first, the position closes normally at the planned size. In the second, adverse price movement reduces available margin and the position approaches the maintenance threshold. The second case is where a fee-only comparison fails most sharply: liquidation mechanics, added margin and a forced taker exit can dominate the neat opening-cost calculation.
Spot needs its own adverse case. A market order in a thin book may cross a wider spread than expected, and converting or borrowing the quote currency can add another cost. The comparison is therefore not "spot has no extra costs". It is that the extra costs arise from different mechanisms and respond to different choices.
Use the order ticket as the final source
Public fee pages explain the structure. The order ticket supplies the current product, pair, order type, notional and any promotion that applies at the moment of the decision. Before submitting, record the estimated fee and check whether it is expressed in the settlement asset, margin asset or another token.
For a limit order, confirm whether post-only is enabled if your calculation assumes a maker rate. A limit price alone does not guarantee maker treatment; an immediately marketable limit order removes liquidity and can be charged as a taker. For a futures close, confirm reduce-only when the intention is to decrease rather than reverse a position.
After execution, compare the fee history with the estimate. If they differ, identify which input changed before concluding that the schedule was wrong: partial fills can have different liquidity roles, a token balance can run out, a tier can roll over and a promotional rate can end. That reconciliation teaches more than copying another decimal place from a public table.
Leverage changes more than the fee denominator
Increasing leverage while holding notional exposure constant reduces the margin committed but does not reduce the fee charged on that notional. The same dollar fee therefore consumes a larger share of your committed capital. Increasing leverage while holding margin constant is different again: it increases notional, so the fee itself rises. State which quantity is fixed before comparing scenarios.
Leverage also changes the distance to maintenance margin. A calculation that assumes the position stays open until a planned exit is incomplete if ordinary price movement could force an earlier one. Read the maintenance-margin tier for the intended notional and estimate the liquidation boundary using the platform's own calculator. Do not use a headline maximum leverage as a planning input; it describes an available limit, not a sensible setting.
Cross and isolated margin allocate the consequence differently. Isolated margin limits the collateral assigned to the position. Cross margin can draw on a wider account balance, which may move the liquidation boundary but also exposes funds that were not part of the original position calculation. The trading fee may be identical while the amount at risk is not.
Include the exit you may actually use
Worked examples usually assume an orderly market close. Real exits can be a resting limit order, an immediate market order, a stop that becomes a market order or a forced liquidation. Each interacts with liquidity differently. If the strategy depends on exiting quickly, modelling the maker rate for the close is internally inconsistent.
Add a slippage assumption separately from the fee. Fee is a stated percentage applied by the platform; slippage is the difference between the expected price and the average execution price. Combining them into one line hides which part can be checked before the trade and which depends on market depth at the moment of exit.
Finally, include conversion and withdrawal only when they belong to the actual plan. A spot position moved to self-custody has a withdrawal step that a cash-settled futures position does not. A futures account may require collateral conversion or borrowing that the spot example did not. Comparability comes from drawing the full path for each product, not from forcing both into the same fee-table columns.
Write the path as a sequence of cash amounts: deposit, conversion, opening execution, recurring funding or borrowing, closing execution and final withdrawal. Mark each amount as quoted, estimated or unknown. Unknown is an acceptable result before a trade; it tells you which screen or document still needs to be checked. A precise total built from an assumed live rate is less useful than a range whose uncertain inputs are visible.